Use the figure below to answer the following question.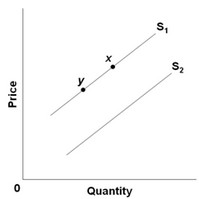 An increase in quantity supplied caused by a change in price is depicted by a
A. movement from point y to point x.
B. shift from S1 to S2.
C. movement from point x to point y.
D. shift from S2 to S1.
Answer: A
You might also like to view...
Which of the following resulted in the financial crisis in 2007-08?
a. Falling international reserves b. Short-term investments made by China in the US c. Lack of transparency d. Bad loans on U.S. mortgages e. Fixed rates of interest
Equilibrium price is _____ and equilibrium quantity is _____ units.
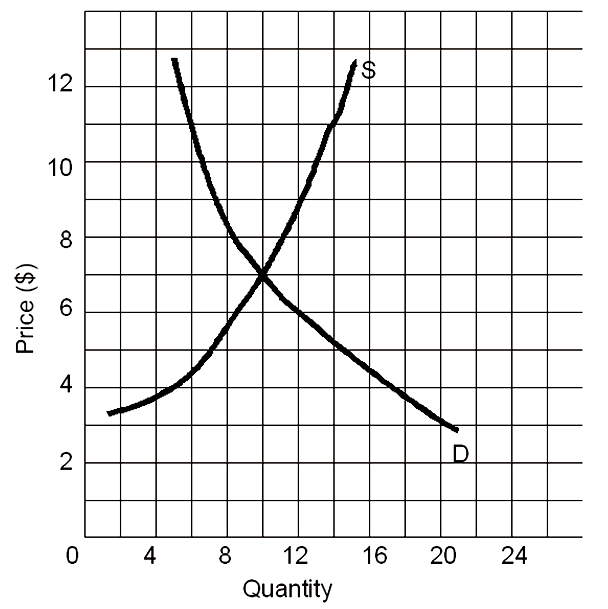
A. $8; 9
B. $7; 10
C. $6; 10
D. $5; 9
Based on the graph showing how the subprime share of home mortgages grew rapidly before the big decline, the share of subprime loans began its steepest climb ______.
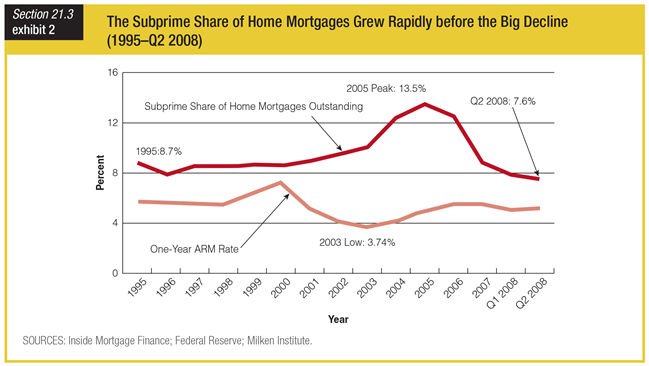
a. about the same time adjustable mortgage rates bottomed-out
b. about three years after adjustable mortgage rates bottomed-out
c. about three years before adjustable mortgage rates bottomed-out
d. about the same time adjustable mortgage rates began to decrease
If both buyers and sellers expect the price of a commodity to fall in the future, it is likely that the market clearing price ________ and the equilibrium quantity ________.
A. cannot be predicted, will fall B. cannot be predicted, will rise C. will rise, cannot be predicted D. will fall, cannot be predicted