Provide an appropriate response.Does it appear that a linear model or a quadratic model is the best fit for the data given in the table below? Explain your choice.
What will be an ideal response?
Since the second differences are closer to being equal than the first differences, a quadratic model will be a better fit than a linear model.
You might also like to view...
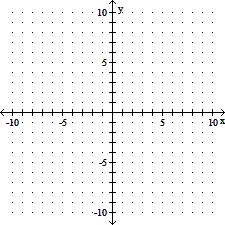
Graph the function.f(x) = 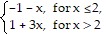
A. 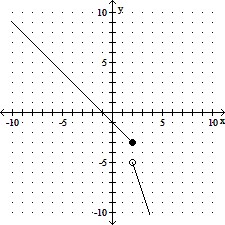
B. 
C. 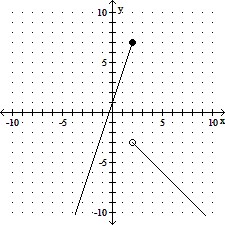
D. 
Use a graphing calculator to estimate the local maximum and local minimum values of the function to the nearest hundredth.y = 3x3 - 4x2 - 6x + 2
A. Local max: (-0.48, 3.68); local min: (1.38, -6.15) B. Local max: (-0.44, 3.61); local min: (1.45, -5.97) C. Local max: (-6.01, 1.38); local min: (3.63, -0.48) D. Local max: (-0.48, 3.63); local min: (1.38, -6.01)
Tell whether a linear model or a quadratic model is appropriate for the data. If a quadratic model is appropriate, then decide also whether the lead coefficient should be positive or negative.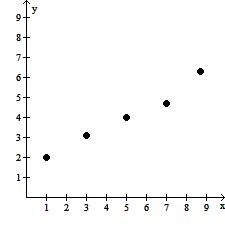
A. Quadratic; leading coefficient positive B. Linear C. Quadratic; leading coefficient negative
Solve the problem.Use the formula d = 10 log (I/I0), where the loudness of a sound in decibels is determined by I, the number of watt/m2 produced by the soundwave, and  watt/m2. What is the intensity in watt/m2 of a noise measured at 84 decibels? Round to the nearest tenth.
A. 2.5 × 10⁻³ watt/m2 B. 2.5 × 10⁻⁴ watt/m2 C. 8.4 × 10⁻¹⁰ watt/m2 D. 4.4 × 10¹⁵ watt/m2