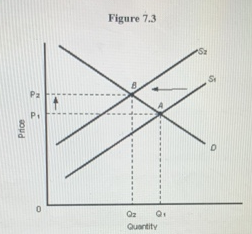
Refer to Figure 7.3. Which of the following explains the shift in the supply curve from S1 to S2?
a. Discoveries of natural gas
b. Wage concessions by union members
c. Businesses reducing their profit margins
d. Decreases in oil supplies as experienced in the 1970s
e. Increased foreign demand for domestic products
Answer: d. Decreases in oil supplies as experienced in the 1970s
You might also like to view...
________ are the time and resources spent trying to exchange goods and services
A) Bargaining costs B) Transaction costs C) Contracting costs D) Barter costs
Aggregate demand is the sum of total domestic spending by the private sector
a. True b. False Indicate whether the statement is true or false
The Fed pushed interest rates to artificially low levels during 2002-2004 . The Austrian view predicts that this policy will lead to
a. excessive investment in long-lasting assets like housing that will eventually prove to be unprofitable and result in recession. b. an increase in sound investments that will propel future economic growth. c. a reduction in the general level of prices that will throw the economy into a recession. d. an increase in aggregate demand that will generate sustainable expansion in both real output and employment.
The goal of macroeconomics is to explain the economic changes that affect many households, firms, and markets simultaneously
a. True b. False Indicate whether the statement is true or false