Figure 36-4
?
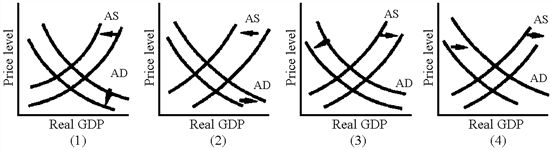
Which of the situations illustrated in Figure 36-4 shows a currency appreciation leading to disinflation?
A. 1
B. 2
C. 3
D. 4
Answer: C
You might also like to view...
Figure 4.2 illustrates the supply and demand for t-shirts. If the actual price of t-shirts is $15, we would expect that
A) price will decrease until quantity demanded equals quantity supplied. B) supply will increase until quantity demanded equals quantity supplied. C) demand will decrease until quantity demanded equals quantity supplied. D) there will be no change in the price since the market is in equilibrium.
The distribution of income and wealth in colonial America was
(a) relatively equal to that of modern America. (b) relatively unequal to that of modern America. (c) unequal in roughly the same degree as that in modern America. (d) unequal, but the data are not good enough to allow a comparison with modern America.
The Sherman Antitrust Act of 1890 was followed almost immediately in the 1890s by the largest merger movement ever known by Americans up to that point in U.S. history
Indicate whether the statement is true or false
The PPF between goods X and Y will be a downward-sloping
A) straight line if increasing opportunity costs exist. B) straight line if decreasing opportunity costs exist. C) curve that is bowed outward if increasing opportunity costs exist. D) curve that is bowed outward if constant opportunity costs exist.