Use the pictograph to answer the question.For selected countries, this pictograph shows approximately how many kilograms of seafood are consumed by each person (per capita) annually.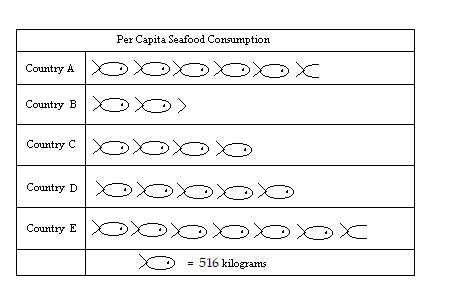 Which country consumes the most seafood?
A. Country A
B. Country E
C. Country B
D. Country C
Answer: B
You might also like to view...
Write the decimal as a fraction in lowest terms.0.406
A. 
B. 
C. 
D. 
A study on worldwide oil use was prepared for a major oil company. The study predicted that the amount of oil used to fuel productivity in a certain country is given by
?

?
where f (t) denotes the number of barrels per $1,000 of economic output and t is measured in decades ( corresponds to 1965). Compute f '(0) and f ?'(2).
?
Round the answer to the nearest hundredth.
?
A. 
?
B. ?

?
C. ?

?
D. ?

?
E. ?

?
Solve the system.5w - 3y + z = 16-w + 5x + y - 5z = 125w - x + + 3z = 17 x - 5y - z = -12
A. (5, 0, -3, 0) B. (1, -2, -7, -5) C. (6, -2, 3, -5) D. (-2, 6, 5, -6)
Solve the equation.59 = 7w + 10
A. w = 7 B. w = 42 C. w = 1 D. w = 46