Use the following graph for the market for beef to answer the question below.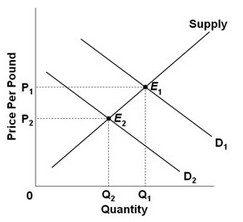 Refer to the graph, which shows that the demand for beef shifted from D1 and D2. The change in equilibrium from E1 to E2 is most likely to result from a(n)
A. increase in the cost of cattle feed.
B. decrease in consumer incomes.
C. increase in the price of pork.
D. decrease in the tax on beef products.
Answer: B
You might also like to view...
Credit cards are regularly used in economic? exchanges, so credit card balances are included in the definition of money.
Indicate whether the statement is true or false.
If a country's production possibilities curve gets more bowed out over time, it is an indication that
A) technological change has taken place. B) society is learning to use its resources more efficiently. C) the quantity of labor and capital have increased. D) resources have become more highly specialized.
Which of the following sequence of events follows a decrease in the discount rate?
A. r? ? I? ? AE? ? Y? B. r? ? I? ? AE? ? Y? C. r? ? I? ? AE? ? Y? D. r? ? I? ? AE? ? Y?
A decrease in net taxes will result in consumption crowding out planned investment when the economy is on the steep part of the AS curve.
Answer the following statement true (T) or false (F)