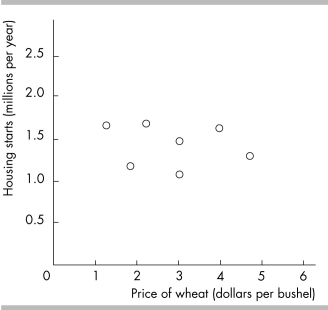
?The above figure graphs the price of a bushel of wheat and housing starts. The graph shows the variables are
a. not related
b. related via an indirect relationship.
c. strongly positively related.
d. strongly negatively related.
Answer: a. not related
You might also like to view...
The above figure shows the reaction functions for two pizza shops in a small isolated town. The Stackelberg leader will produce
A) 25 pizzas. B) 50 pizzas. C) 66.7 pizzas. D) 100 pizzas.
How does increased immigration affect the labor market? How would the equilibrium wage and the equilibrium quantity of labor be affected?
If the wage rate were $250, how many workers would be hired?
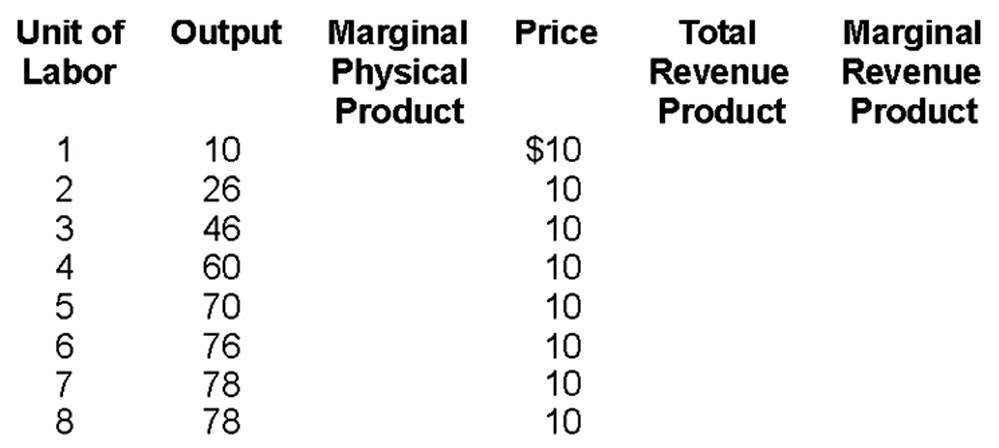
A. 3
B. 4
C. 5
D. 0
Refer to the diagram. Line (2) reflects a situation where resource prices:
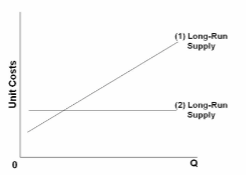
A. decline as industry output expands.
B. increase as industry output expands.
C. rise and then decline as industry output expands.
D. remain constant as industry output expands.