Which curve summarizes inequality visually?
A. Income Inequality curve
B. Gini curve
C. Lorenz curve
D. Laffer curve
Answer: C
You might also like to view...
Suppose Firm A and Firm B are considering whether to invest in a new production technology. For each firm, the payoff to investing (given in thousands of dollars per day) depends upon whether the other firm invests, as shown in the payoff matrix below. 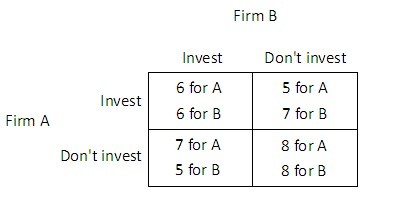 Is this game a prisoner's dilemma?
A. No. B. Yes. C. It cannot be determined. D. Only when both Firm A and Firm B invest.
Other things being equal, when the Fed buys U.S. government securities
A) the quantity of paper currency and coins in circulation expands by more than the amount of the Fed's purchase. B) the Fed's total assets and total liabilities immediately expand by exactly the amount of the Fed's purchase. C) the U.S. Treasury must immediately issue new securities to replace the securities that the Fed has removed from the market. D) the quantity of deposits in the U.S. banking system expands by less than the amount of the Fed's purchase.
Total market demand can be calculated by
A) horizontally summing individual demand curves at each and every price level. B) vertically summing individual demand curves at each and every income level. C) adding up the largest quantity demanded by each individual. D) looking at the changes in the products' popularity.
An anti-inflation policy that involves announcing and executing tough measures to stop inflation is called _____
a. cold turkey b. red tape c. a pork-barrel policy d. chokehold e. time-inconsistency