Graphically, producer surplus is measured as the area:
A. under the demand curve and below the actual price.
B. under the demand curve and above the actual price.
C. above the supply curve and above the actual price.
D. above the supply curve and below the actual price.
Answer: D
You might also like to view...
Use the following graph, which shows the market for euros, to answer the next question.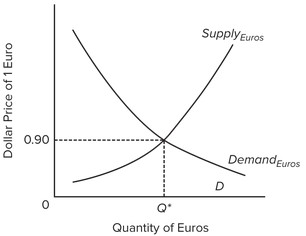 Assume the U.S. and European governments adopt a system of flexible exchange rates. If more people in Europe decide to purchase U.S. cars, what effect will this have on the market for euros?
A. The supply of euros will decrease. B. The supply of euros will increase. C. The demand for euros will decrease. D. The demand for euros will increase.
The marginal cost curve crosses the average total cost curve at the
a. highest level of average total cost. b. lowest level of average total cost. c. point where the ATC equals the AVC. d. point where the ATC equals the AFC.
In 1789, the average American paid approximately what percent of income in taxes?
a. 5% b. 15% c. 33% d. 50%
The price level has been rising 5 percent a year for 10 years and is expected to continue to do so. The nominal rate of interest is 4 percent. The real rate of interest is
A. 9 percent. B. 5 percent. C. 1 percent. D. -1 percent.