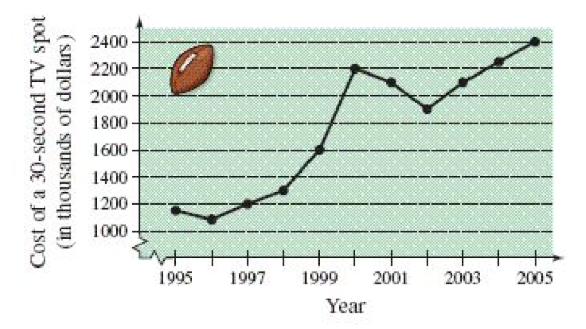
Estimate the increase in the cost of a 30-second spot from the Super Bowl in 1998 to the Super Bowl in 2002.
The line graph shows the costs of a 30-second television spot (in thousands of
dollars) during the Super Bowl from 1995 to 2005.
A) 1080 thousand dollars
B) 1200 thousand dollars
C) 300 thousand dollars
D) 900 thousand dollars
E) 600 thousand dollars
E) 600 thousand dollars
You might also like to view...
Find an equation of variation in which the following are true.y varies directly as x and inversely as z, and y = 10 when x = 2 and z = 4.
A. y = 
B. y = 23xz
C. y = 
D. y = 
Find the distance between the pair of points.(-7, -7) and (2, 6)
A. 4
B. 5
C. 88
D. 88
Suppose that the people in a certain city are catching cold. It is observed that after one week, 40% of the people who were sick are still sick. Of the people who were well, 30% are sick after one week. Set up the  stochastic matrix with columns and rows labeled S and W that describes this situation.
A. 


B. 


C. 


D. 


Factor the trinomial completely.
What will be an ideal response?