According to the graph shown, if this economy were an autarky, consumers would get area:
This graph demonstrates the domestic demand and supply for a good, as well as the world price for that good.
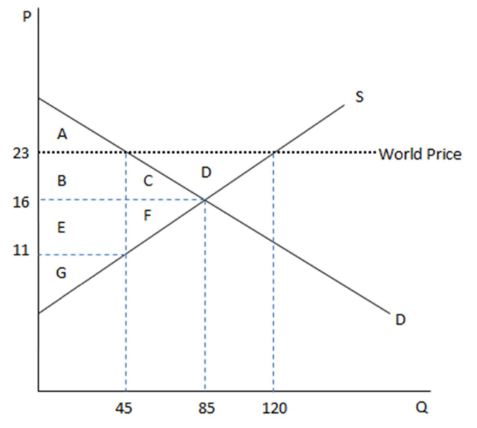
A. A in consumer surplus.
B. ABC in consumer surplus.
C. ABCD in consumer surplus.
D. ABCDEFG in consumer surplus.
B. ABC in consumer surplus.
You might also like to view...
Why is it inefficient for an economy to be inside the production possibilities frontier?
What will be an ideal response?
The ________ describes the relationship between the amount of labor employed and real GDP
A) production function B) production possibilities frontier C) Lucas Wedge D) inflation rate E) Okun Gap
Compared to other high-income countries, health care spending per person in the United States has been
A) declining at a faster rate. B) declining at approximately the same rate. C) growing at a faster rate. D) growing at approximately the same rate.
If the quantity demanded of milk is 55,000 gallons and the quantity supplied of milk is 80,000 gallons, then
a. there is an excess supply of 25,000 gallons of milk b. the price of milk will rise to clear the market c. consumers get the milk they demand so equilibrium exists d. there is an excess demand of 25,000 gallons of milk e. the supply curve is greater than the demand curve