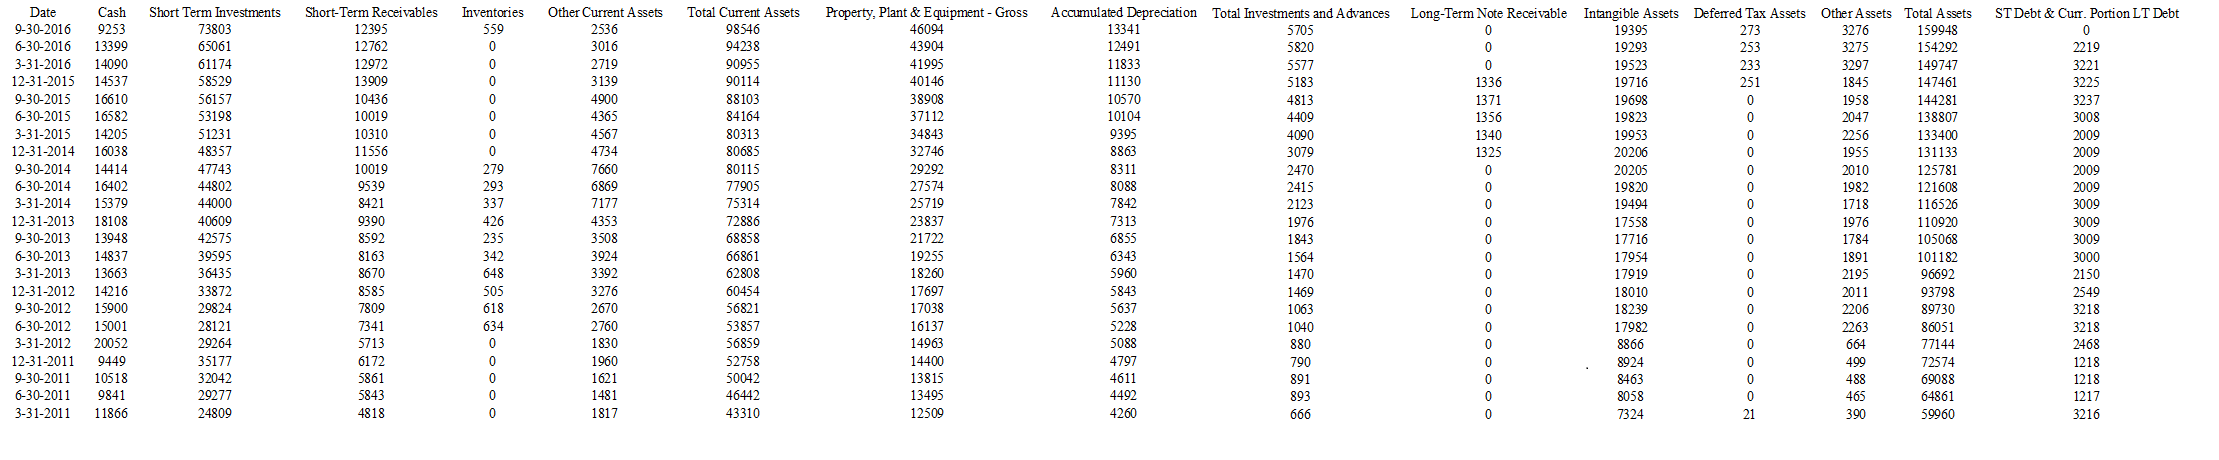
Using the data in the Alphabet Financials.xlsx workbook that was used in the chapter:
a) Convert the balance sheet to a Table that is named Raw_BalanceSheet.
b) Use Get & Transform to convert the balance sheet into a format that is suitable for a pivot table by transposing the data. Be sure to set the correct data types for each column, and replace errors with a value of 0. Don’t forget to enter the word “Date” above the dates. Name the query Transposed_BalanceSheet.
c) Build a pivot table from the data and group the dates by quarters and years.
d) Create a calculated field that shows the total debt ratio, and format the result as a percentage with two decimal places.
e) Create a pivot chart that shows the debt ratio over time. Has Alphabet’s capital structure changed over this 6-year period?
2. Using the same workbook:
a) Transpose the income statement using Get & Transform as you did with the balance sheet in problem 1. Name this query Transposed_IncomeStatement.
b) Use Get & Transform -> New Query -> Combine Queries -> Merge to merge the Transposed_IncomeStatement and Transposed_BalanceSheet queries. Do a Full Outer Join to use all rows from both queries. Call this query Combined_Financials and load it to a new worksheet.
c) Create a new Pivot Table from the Combined_Financials table. Add a Date field that shows years and quarters.
d) Create two calculated fields that show the net profit margin (NPM) and return on total assets (ROA).
e) Create a pivot line chart that shows the data from part (d). Place the ROA on a secondary y-axis.
f) Does there appear to be a strong correlation between the two data series? Use the Correl function to calculate the correlation coefficient.
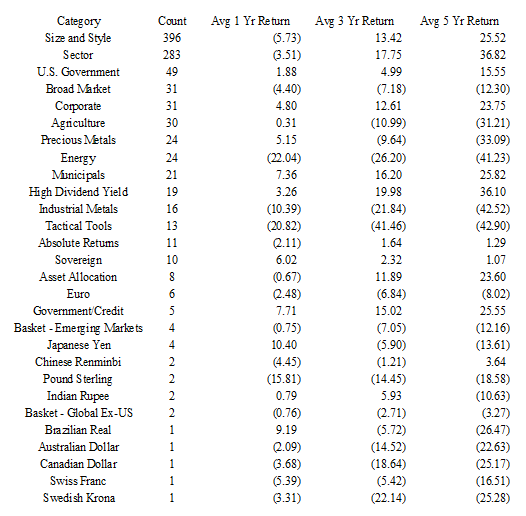
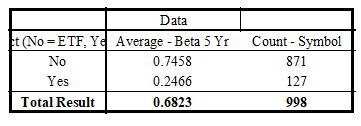
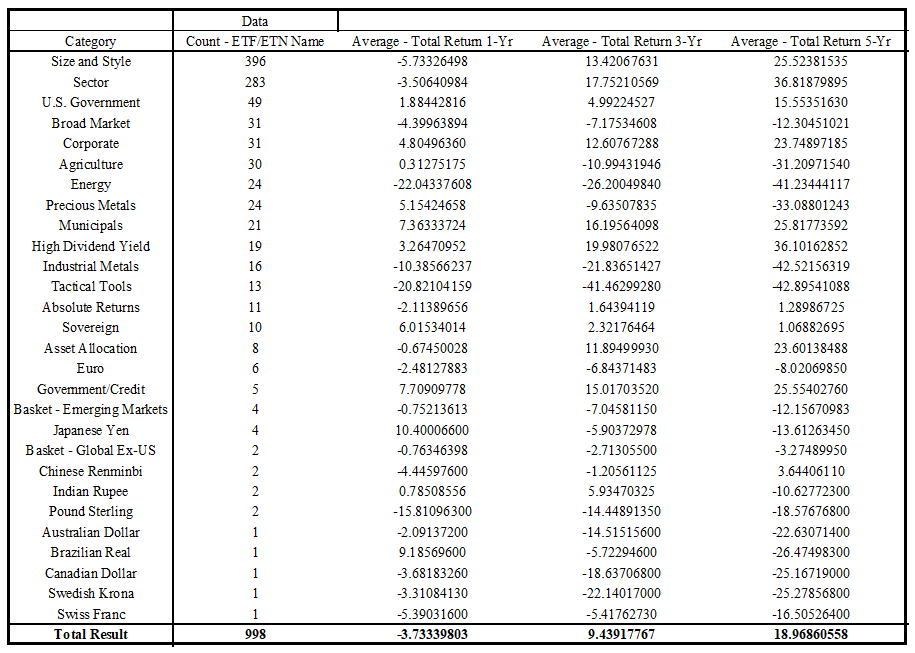
3. Using the ETF Data.xlsx workbook from the chapter:
a) Use Get & Transform on the data to create a query that shows average Beta by ETF Struct. To do this, use the Group By button to group the data by ETF Struct and then create a new column called Avg Beta. Also create a second aggregation that shows the count of each type of fund. Name the query Avg_Beta_by_Structure and load it to a new worksheet.
b) What is the average beta for each type of fund, and how many of each are in the dataset?
c) Create another query, called Average Returns by Category, that shows the number of funds in each category and the average of the 1 year, 3 year, and 5 year returns by category.
d) Return to the data and create a pivot table that shows the same results as you got in part (a).
e) Return to the data and create a pivot table that shows the same results as you got in part (c).
f) Add a Timeline and use it to filter the pivot table so that it shows the operating profit margin from 2000 to the present.


Avg Beta by Structure

Avg Returns by Category
Avg Beta by Structure PT
Avg Returns by Category PT
You might also like to view...
Which category of companies is characterized by an organization culture which is primarily influenced by the home country?
a. International b. Multinational c. Global d. National
Which of the following describes the most typical order of entry into foreign markets?
A. licensing, exporting, franchising, joint venture, and wholly owned subsidiary B. exporting, franchising, licensing, joint venture, and wholly owned subsidiary C. franchising, licensing, exporting, joint venture, and wholly owned subsidiary D. exporting, licensing, franchising, joint venture, and wholly owned subsidiary
Mobile banking describes the performance of banking activities via a mobile device
Indicate whether the statement is true or false
What does the phrase "living below your means" really mean and how is it related to wealth building?
What will be an ideal response?