Solve the problem.The town of Appleville recorded the following dates and populations.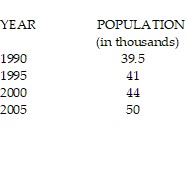
 (i) Draw a graph of the population as a function of time. (ii) What is the approximate population of Appleville in 1997?
A. (i) 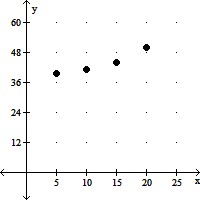
(ii) 44,000
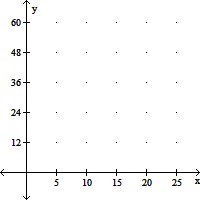
B. (i) 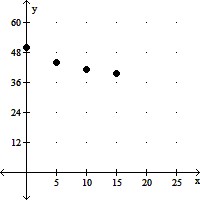
(ii) 43,000
C. (i)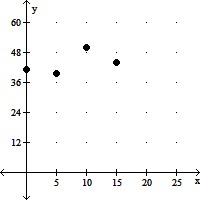
(ii) 41,000
D. (i)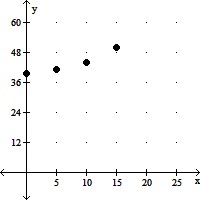
(ii) 42,000
Answer: D
Mathematics
You might also like to view...
Provide an appropriate response.For what values of a will the following system of equations have a solution?
Fill in the blank(s) with the appropriate word(s).
Mathematics
Solve the inequality and graph the solution on the real number line.

Mathematics
Identify the coordinates of each point in the graph.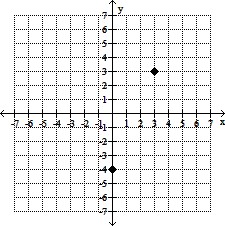
A. (3, 3); (0, 4) B. (-3, 3); (0, 4) C. (3, -3); (1, -4) D. (3, 3); (0, -4)
Mathematics
Solve the formula for the specified variable.I =  for n
for n
A. n = IR(Ir - E)
B. n = 
C. n = 
D. n = 
Mathematics