This double-bar graph shows the number of male (M) and female (F) athletes at a university over a four-year period. Answer the question.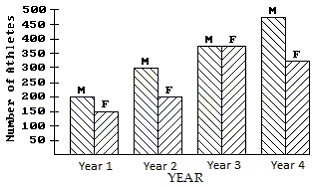 Which year had the greatest number of male athletes?
A. Year 1
B. Year 2
C. Year 4
D. Year 3
Answer: C
You might also like to view...
The following table shows the length L, in centimeters, and the weight W, in grams, of a certain type of fish. L 28.5 32.4 38.2 42.6 46.06 W 222 317 510 680 909? Use a power model to answer the following. If one fish is half the length of another, how do their weights compare? Round your answer to two decimal places. ?
A. The shorter fish is 86.51% lighter. B. The shorter fish is 88.30% lighter. C. The shorter fish is 14.89% lighter. D. The shorter fish is 13.49% lighter.
Find the first four nonzero terms of the Maclaurin expansion of the given function.f(x) = 
A. 1 -  x6 +
x6 +  x12 -
x12 -  x18 - ...
B. 1 -  x6 -
x6 -  x12 -
x12 -  x18 - ...
C. 1 +  x6 -
x6 -  x12 +
x12 +  x18 - ...
D. 1 +  x -
x -  x2 +
x2 +  x3 - ...
Find the area of the circle. Use ? ? 3.14 and round to the nearest hundredth.diameter = 11 in
A. 34.54 in2 B. 379.94 in2 C. 94.99 in2 D. 69.08 in2
Use properties of logarithms to write the expression in terms of logarithms of x, y, z.ln(x3y5z4)
A. ln 3x + ln 5y + ln 4z
B. ln  + ln
+ ln  + ln
+ ln 
C. 3 ln x - 5 ln y - 4 ln z
D. 3 ln x + 5 ln y + 4 ln z