Which of the following graphs are equivalent?
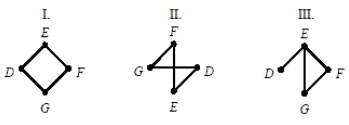
a. I, II, & III
b. I & II
c. II & III
d. I & III
b. I & II
You might also like to view...
Solve the quadratic equation by completing the square.8x2 + 1 = 3x
A. 
B. 
C. 
D. 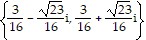
Solve the problem.Coyotes are one of the few species of North American animals with an expanding range. The future population of coyotes in a region of Mississippi can be modeled by the equation 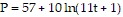 , where t is time in years. Use the equation to determine when the population will reach 150. (Round to the nearest tenth of a year.)
A. 994.5 years B. 181,387,483 years C. 994.3 years D. 994.6 years
Express the sum using summation notation. Use 1 as the lower limit of summation and i for the index of summation.3 + 12 + 27 + . . . + 75
A. 
B. 
C. 
D. 
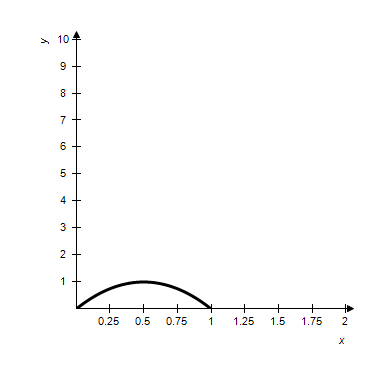
Determine the area of the given region.
?
 ?
?
 ?
?
A. 
B. 
C. 
D. 
E. None of the above