The manufacturer of Beanie Baby dolls used quarterly price data for 2005 I - 2013 IV (t = 1, ..., 36) and the regression equationPt = a + bt + c1D1t + c2D2t + c3D3tto forecast doll prices in the year 2014. Pt is the quarterly price of dolls, and D1t, D2t, and D3t are dummy variables for quarters I, II, and III, respectively. 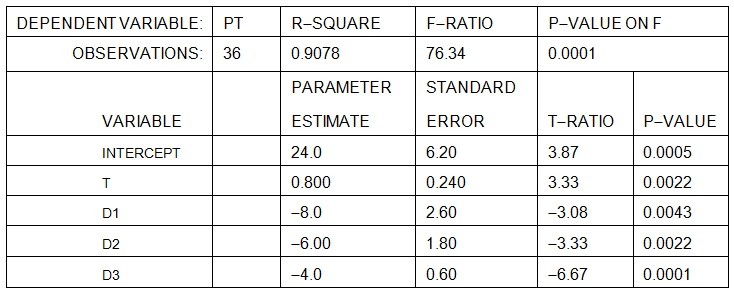 The estimated QUARTERLY increase in price is ________, and the estimated ANNUAL increase in price is ________ .
A. $0.60; $2.40
B. $1.50; $6.00
C. $0.80; $3.20
D. $1.40; $4.00
E. none of the above
Answer: C
You might also like to view...
Strategic complementarities may help explain business cycles because such complementarities may lead to
A) decreasing returns to scale. B) constant returns to scale. C) increasing returns to scale. D) a downward-sloping labor supply curve.
Suppose demand for a good is QD = 100 - P and supply is QS = -20 + P. What is the equilibrium quantity?
a. 20 b. 40 c. 60 d. 80
Which of the following is not an example of market failure?
a. Extreme income inequality b. Externalities c. Efficient equilibrium d. Lack of competition
The level of real GDP is a good measure of economic prosperity, and the growth of real GDP is a good measure of __________
Fill in the blank(s) with correct word