A demand curve shows the relationship between
a. price and quantity demanded
b. the demand and supply schedules
c. demand and supply equilibrium
d. leakages and injections
e. price and technology
A
You might also like to view...
Economists have said that deregulation of the electric utility industry might lead to increased prices in the short run, but prices will fall in the long run. In this context:
a. the short run means the middle of next year. b. the short run means the period after all adjustments have been made, and the quantities of all resources have been varied as necessary. c. the long run means after all adjustments have been made, the quantities of all resources have been varied as necessary, and new market entrants begin producing electricity. d. the short run means the period after new firms begin producing electricity. e. the long run means approximately ten years.
Based on the figure below. Starting from long-run equilibrium at point C, a tax cut that increases aggregate demand from AD to AD1 will lead to a short-run equilibrium at point ________ and eventually to a long-run equilibrium at point ________, if left to self-correcting tendencies. 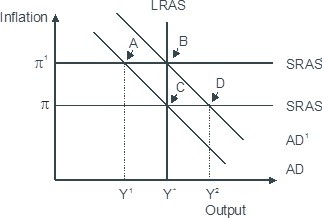
A. D; C B. B; C C. B; A D. D; B
An increase in the price level in an economy will
What will be an ideal response?
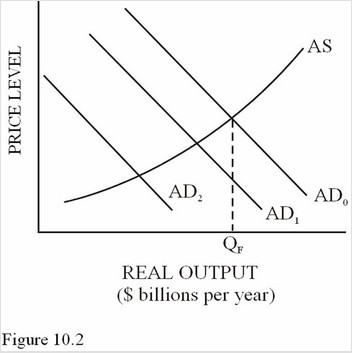 Suppose an initial increase in spending cause the aggregate demand curve in Figure 10.2 increases by a total of $60 billion, from AD2 to AD0. Equilibrium GDP will
A. Increase by less than $60 billion because some of the additional spending drives up prices. B. Increase by $60 billion. C. Decrease because higher inflation causes unemployment. D. Increase by more than $60 billion because of the multiplier effect.