The table shows, for some particular year, a listing of several income levels and, for each level, the proportion of the population in the level and the probability that a person in that level bought a new car during the year. Given that one of the people who bought a new car during that year is randomly selected, find the probability that that person was in the indicated income category. Round your answer to the nearest hundredth. 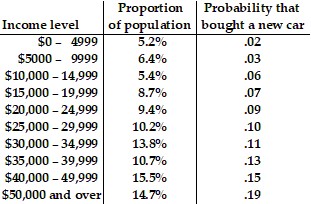 $20,000 - $24,999
A. .11
B. .08
C. .06
D. .07
Answer: B
Mathematics
You might also like to view...
Find an equation of the tangent line at x = a.y = x2 + 4; a = 4
A. y = 8x - 12 B. y = 4x - 12 C. y = 8x - 24 D. y = 8x - 28
Mathematics
Provide an appropriate response. Which board is longer? One that is seventy-two and four fifths inches or one that is seventy-two and seven eighths inches? Explain how you know.
What will be an ideal response?
Mathematics
Use the order of operations agreement to simplify the given expression. ?
?  - 3
- 3
A. 
B. 
C. 
D. 
Mathematics
Use the four-step process to find the slope of the tangent line to the graph of the given function at any point.
?
 ?
?
 __________
Fill in the blank(s) with the appropriate word(s).
Mathematics