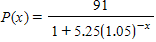
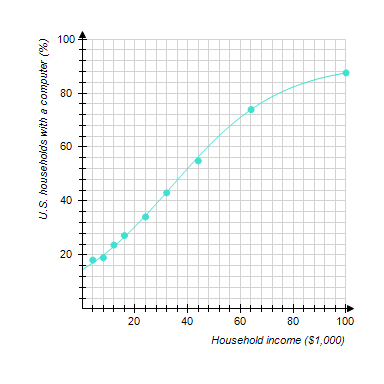
The following graph shows the actual percentage of U.S. households with a computer as a function of household income (the data points) and a logistic model of these data (the curve). The logistic model is
?
?
where x is the household income in thousands of dollars. For low incomes, the logistic model is approximately exponential. Which exponential model best approximates P(x) for small x? Round the coefficients to the nearest hundredth.
?
?
?P(x) = ________ ·( ________)x
What will be an ideal response?
14.56; 1.05
You might also like to view...
Provide an appropriate response.Use a graphing calculator to choose the equation which corresponds to the graph.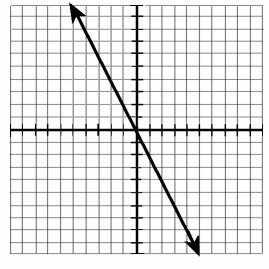
A. y = 2x - 2 B. y = 2x C. y = -2x D. y = -2x - 2
Solve.The daily profit in dollars of a specialty cake shop is described by the function  where x is the number of cakes prepared in one day. The maximum profit for the company occurs at the vertex of the parabola. What is the maximum profit?
A. $170.00 B. $204,504 C. $28,900 D. $142,296
Factor. Assume that variables used as exponents represent positive integers.x2n - 13xn + 42
A. (xn - 7)(xn - 6) B. prime polynomial C. (xn + 7)(xn - 6) D. (xn + 7)(xn + 1)
Write the logarithmic and exponential equations associated with the display.g(x) = ln x 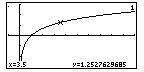
A. ln 3.5 = 1.2527629685; e1.2527629685 = 3.5 B. ln 1.2527629685 = 3.5; e3.5 = 1.2527629685 C. ln 0.54406804435 = 3.5; e3.5 = 0.54406804435 D. ln 3.5 = 0.54406804435; e0.54406804435 = 3.5