Assume that the graphs show a competitive market for the product stated in the question below.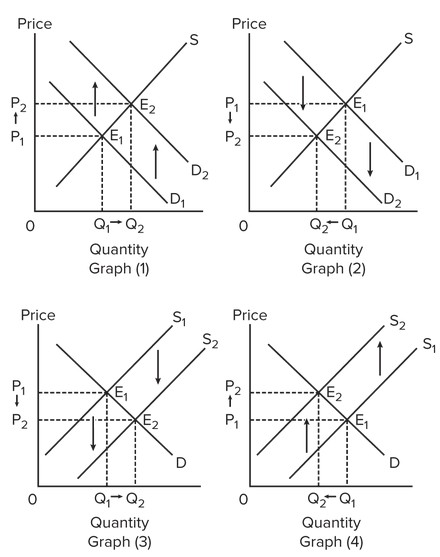 Select the graph that best shows the change in the market following a reduction in the tax placed on the buyers in the market.
A. graph (1)
B. graph (2)
C. graph (3)
D. graph (4)
Answer: A
You might also like to view...
In a dynamic game, rational players
A) will reject outcomes that are not subgame perfect. B) use backward induction to determine best responses. C) have strategies that select a Nash equilibrium in the game as a whole. D) All of the above.
A normal good is defined by economists to be a good:
a. with a negatively-sloped demand curve. b. that is purchased by at least 75 percent of the population. c. that is bought by consumers with normal tastes. d. whose demand increases when incomes increase. e. whose demand decreases when incomes increase.
Which of the following is a transfer payment?
a. The federal government's budget deficit b. Unemployment compensation payments c. Military spending d. Wages of government employees e. The excise tax on gasoline
The average sale price of a home in the United States increased from $207,000 to $297,000 from 2000 to 2005. All else equal, we would expect that during the same time the quantity of new homes supplied
A. did not change. B. also increased. C. decreased. D. changed directly in proportion to changes in the population.