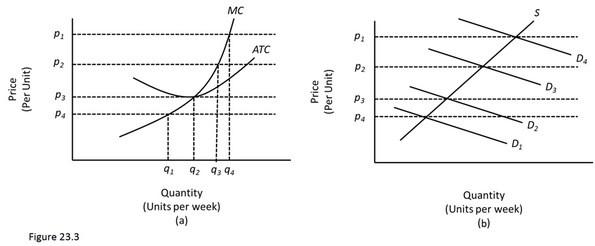
 In Figure 23.3, diagram "a" presents the cost curves that are relevant to a firm's production decision, and diagram "b" shows the market demand and supply curves for the market. Use both diagrams to answer the following question: In Figure 23.3, at a price of p2 in the long run
A. Economic profits equal zero.
B. P = AVC.
C. Firms will exit the market.
D. Firms will enter the market.
Answer: D
You might also like to view...
If Southwest Airlines borrows $20 million from a bank to finance the renovation of their corporate offices, this is an example of
A) a stock market transaction. B) a bond market transaction. C) direct finance. D) indirect finance.
In the recent Global Economic Crisis, the negative wealth effect caused
A) LM curve to shift to the right. B) LM curve to shift to the left. C) IS curve to shift to the left. D) LM curve to shift to the right.
Suppose a union successfully negotiates for its members a wage rate that is above the competitive wage rate, then
A) there will be a surplus of jobs. B) antitrust laws become effective. C) there will be downward pressure on the wage rate until equilibrium is established. D) there will be an excess supply of labor.
Suppose that John allocates $10,000 of his disposable income for necessities. Any additional income beyond that is both spent and saved. Assume he has a disposable annual income of $50,000 and an MPC=0.8. Based on this information the additional amount spent on non-necessities should be:
A. $10,000. B. $40,000. C. $32,000. D. $35,000.