Figure 8-1
?
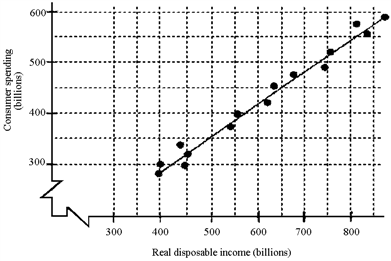
Given the scatter diagram in Figure 8-1, if real disposable income is $600 billion and asset wealth increases by $100 billion, how much will consumers spend?
A. $550 billion
B. $450 billion
C. $600 billion
D. Cannot be determined
Answer: A
You might also like to view...
The Friedman natural rate theory holds that there is an inverse relationship between inflation and unemployment in the long run, but not in the short run
Indicate whether the statement is true or false
Suppose Diego deposits $4,000 in his bank. If the reserve ratio is 10 percent, this will lead to a maximum increase of ________ in checking account balances throughout all banks.
A. $0 B. $4,000 C. $10,000 D. $40,000
Number of workersUnits of output0012525539541255150Table 8.2Refer to Table 8.2, which gives a firm's production function. Assume that all non-labor inputs are fixed. The marginal product of the fifth worker is:
A. 0 units. B. 10 units. C. 25 units. D. 30 units.
As more of a good, such as television sets, is produced, the opportunity costs of producing it increases. This most likely occurs because
A. resources are not equally well suited to producing all goods, and as more of a good is produced, it is necessary to use resources less well suited to the production of that good. B. consumers would be willing to pay higher prices for the good as more of the good is produced. C. as more of a good is produced, the quality of that good declines, and therefore the costs of production increase. D. as more of a good is produced, the inputs used to produce that good will increase in price.