Refer to the diagrams. Diagram (A) represents:
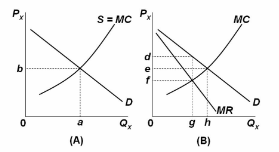
A. equilibrium price and quantity in a purely competitive industry.
B. the pure monopoly model.
C. an industry in which there is productive efficiency but not allocative efficiency.
D. a single firm operating in a purely competitive industry.
A. equilibrium price and quantity in a purely competitive industry.
You might also like to view...
A ________ is an exclusive right granted by the government to an author's intellectual property
A) patent B) blueprint C) copyright D) trademark
The change in any factor other than ________ would shift the demand curve
a. Weather b. interest rate c. Price d. all of the above
The _____ interest rate tells you how fast the number of dollars in your bank account will rise over time, and it is the sum of the _____ interest rate and the _____
Fill in the blank(s) with correct word
If a good that generates negative externalities were priced to take these negative externalities into account, then its:
A. Price would decrease and its output would increase B. Output would increase but its price would remain constant C. Price would increase and its output would decrease D. Price would increase but its output would remain constant