Refer to the graph shown. The shift in the graph from D1 to D2 shows how an expansionary U.S. fiscal policy can cause an increase in: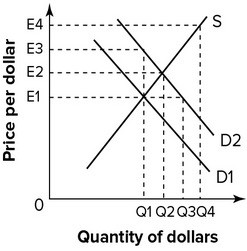
A. interest rates that reduce the dollar's value.
B. prices that raise the dollar's value.
C. prices that reduce the dollar's value.
D. interest rates that raise the dollar's value.
Answer: D
You might also like to view...
Suppose the desired reserve ratio is 10 percent. If Urban Bank has total deposits of $1000 and total assets of $10,000, the amount of desired reserves is
A) $9,000. B) $900. C) $100. D) $1,000. E) $1,100.
Countries that are more open to international trade tend to have
A) property rights that are not well defined. B) higher levels of economic growth. C) lower levels of physical capital. D) lower levels of economic growth.
U.S. households headed by __________ are the most likely to be poor.
A. Hispanic males B. those under age 18 C. single males D. single women
In 2014, the largest source of receipts for state and local governments was corporate income taxes
a. True b. False Indicate whether the statement is true or false