Solve the problem.The following table shows the bumping rate per 10, 000 passengers for Airline X from 1994 through 1998. Predict the bumping rate in 2003 by using regression to find a quadratic function that fits the data. (Round answer to the nearest hundredth.)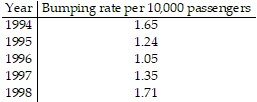
A. 8.38
B. 10.30
C. 10.57
D. 18.40
Answer: A
You might also like to view...
Use the given transformation to evaluate the integral. src="https://sciemce.com/media/4/ppg__tttt0613191206__f1q28g7.jpg" alt="" style="vertical-align: -4.0px;" />

 Rwhere R is the parallelogram bounded by the lines


A. - 
B. - 
C. - 
D. - 
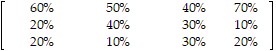
Solve the problem using matrices.State University has a College of Arts & Sciences, a College of Business, and a College of Engineering. The percentage of students in each category are given by the following matrix. src="https://sciemce.com/media/4/ppg__tttt0518191431__f1q85g5.jpg" style="vertical-align: -32.0px;" />

 The student population is distributed by class and age as given in the following matrix.
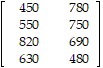 How many female students are in the College of Business? How many male students are in the College of Arts & Sciences?
A. 711 students; 534 students
B. 1314 students; 619 students
C. 517 students; 711 students
D. 619 students; 1455 students
Find the intervals over which the given function is increasing, is decreasing, or is constant.f(x) = 2x + 5
A. increasing on (-?, ?) B. constant on (2, 5) C. decreasing on (-?, 2/5); increasing on (2/5, ?) D. decreasing on (-?, ?)
Divide the expression. You may want to use the property  =
=  +
+  . Do not use a calculator.
A.  x2 - 8
B. 3x - 1
C.  x -
x - 
D. 3x - 8