Figure 11-3
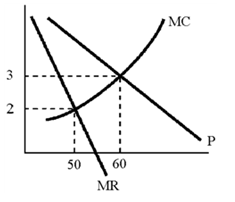
Using the graph in Figure 11-3, the profit-maximizing monopolist will charge a price
A. of more than $3.
B. of $3.
C. between $2 and $3.
D. of $2.
Answer: A
You might also like to view...
Which of the following statements is true?
A) Marginal analysis is a key component in the process of optimization in levels. B) In both the techniques of optimization, all costs have to be converted to the same unit of measurement. C) Optimization in levels calculates the change in net benefits when a person switches from one alternative to another. D) Only direct costs are considered when the net benefits of the alternatives are calculated.
Gene's Car Wash is a natural monopoly. To wash 100 cars a week, if Gene is unregulated, he would charge a price of $10. Gene's long-run average cost for washing 100 cars is $8, his average variable cost is $6, and his marginal cost is constant at $4
If Gene was regulated using a marginal cost pricing rule, the price he would be allowed to charge to wash 100 cars is A) $10. B) $8. C) $6. D) $4.
Suppose the market demand curve is perfectly elastic in an increasing-cost industry. If an output tax of t per unit is imposed on all producers of the good, what happens to the market equilibrium outcome?
A) The price paid by buyers increases and output declines B) The price paid by buyers does not change and output decrease C) The price paid by buyers and output increase D) The price paid by buyers and output decrease
Agriculture is a sector of the economy where increased productivity has been accompanied by a significant decrease in employment.
Answer the following statement true (T) or false (F)