Figure 11-2
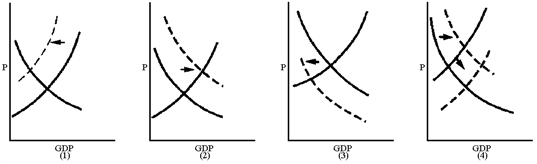
Which graph in Figure 11-2 best reflects a supply-sider's view of the impact of an increase in the personal income tax rate?
a.
1
b.
2
c.
3
d.
4
a
You might also like to view...
The point price elasticity of demand for red herring is -4. The demand curve for red herring is: Q = 120 - P. What is the price of red herring?
A) $96 B) $80 C) $100 D) $120 E) none of the above
All of the following are considered trade secrets except which one?
A) the creation of a new product B) plans for future expansion C) customer lists D) product recipes
A realtor in the real estate market is an example of
A) an end user in a shared-input market. B) a platform in a shared-input market. C) a platform in a matchmaking market. D) an end user in a matchmaking market.
How are the fundamental economic decisions determined in North Korea?
A) Individuals, firms, and the government interact in a market to make these economic decisions. B) These decisions are made by the country's elders who have had much experience in answering these questions. C) The government decides because North Korea is a centrally planned economy. D) The United Nations decides because North Korea is a developing economy.