If the farmer is producing 5000 bushels of soybeans at point B in the figure above, we know that
A) the farmer is not using his resources efficiently.
B) the farmer is using his land to produce a crop other than soybeans or corn.
C) the farmer must be using more land than was used in constructing the production possibilities curve.
D) the farmer is using his resources efficiently.
A) the farmer is not using his resources efficiently.
You might also like to view...
When the benefits to society of using a product exceed benefits to the user,
a. the product should be strictly regulated b. the product should be taxed c. the product provides a positive externality d. the product is overproduced at the privately determined equilibrium e. in time the product will not be produced
Oligopolies that produce identical products such as steel have
A. no control over the price of their product because of the availability of perfect substitutes. B. no control over the price of their product because of the large number of buyers in the market. C. some control over the price of their product because each firm sells a substantial share of the market. D. some control over the price of their product because of the small number of buyers in the market.
Holding demand constant, a reduction in supply leads to
A) lower prices and higher quantity demanded. B) lower prices and lower quantity demanded. C) higher prices and higher quantity demanded. D) higher prices and lower quantity demanded.
Refer to the short-run production and cost data. The curves of Figures A and B suggest that:
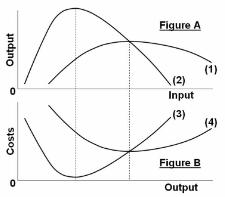
A. marginal product and marginal cost reach their maximum points at the same output.
B. marginal cost reaches a minimum where marginal product is at its maximum.
C. marginal cost and marginal product reach their minimum points at the same output.
D. AVC cuts MC at the latter's minimum point.