Refer to the figure below. Moving from demand curve D1 to demand curve D2 illustrates a(n):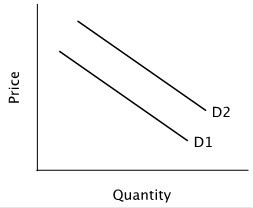
A. decrease in quantity demanded.
B. increase in quantity demanded.
C. increase in demand.
D. decrease in demand.
Answer: C
You might also like to view...
Producer surplus is the ________ summed over the quantity sold
A) value of a good minus the price received for it B) price received for a good minus the value of the good C) price received for a good minus its marginal cost D) marginal cost of making a good minus the price received for it
The states that were hit hardest by the bank failures of the late 1980s
a. were primarily dependent on agriculture and the oil industry b. were primarily dependent on tourist revenues c. were located on the West coast d. were primarily dependent on fishing e. were located in the Northeast
Which statement is true?
A. Since the monopolist is the only firm in the industry, its profit is calculated differently from the way a perfect competitor would calculate profit. B. The monopolist's demand curve and marginal revenue curve are the same line. C. In the long run under monopoly, the most efficient output is the most profitable output. D. A monopolist may lose money in the short-run.
The long-run aggregate supply curve represents:
A. potential output in the economy. B. a production function for the entire economy. C. the level of output possible if the economy is operating at full capacity. D. All of these are true.