Analyze the graph of the given function f as follows:(a) Determine the end behavior: find the power function that the graph of f resembles for large values of |x|.(b) Find the x- and y-intercepts of the graph.(c) Determine whether the graph crosses or touches the x-axis at each x-intercept.(d) Graph f using a graphing utility.(e) Use the graph to determine the local maxima and local minima, if any exist. Round turning points to two decimal places.(f) Use the information obtained in (a) - (e) to draw a complete graph of f by hand. Label all intercepts and turning points.(g) Find the domain of f. Use the graph to find the range of f.(h) Use the graph to determine where f is increasing and where f is decreasing.f(x) = (x + 1)(x - 3)2
What will be an ideal response?
(a) For large values of |x|, the graph of f(x) will resemble the graph of y = x3.
(b) y-intercept: (0, 9), x-intercepts: (3, 0) and (-1, 0)
(c) The graph of f crosses the x-axis at (-1, 0) and touches the x-axis at (3, 0).
(e) Local minimum at (3, 0); Local maximum at (0.33, 9.48)
(f) 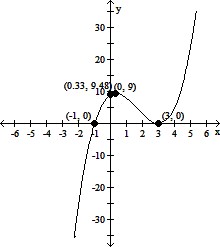
(g) Domain of f: all real numbers; range of f: all real numbers
(h) f is increasing on (-?, 0.33) and (3, ?); f is decreasing on (9.48, 3)
You might also like to view...
Graph the rational function.y = 
A. 
B. 
C. 
D. 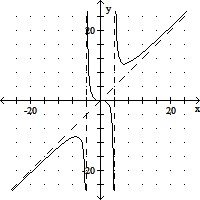
Solve the proportion. Round the solution to the given place value. =
=  ; hundredths place
A. 253.33 B. 12.83 C. 0.08 D. 6.32
If the following is a polynomial function, then state its degree and leading coefficient. If it is not, then state this fact.f(x) = -14 - 13x - 6x2 + 13x3 - 7x4
A. Not a polynomial function. B. Degree: 4; leading coefficient: -14 C. Degree: -14; leading coefficient: -7 D. Degree: 4; leading coefficient: -7
Tell whether a linear model or a quadratic model is appropriate for the data. If linear, tell whether the slope should be positive or negative. If quadratic, decide whether the leading coefficient a of x2 should be positive or negative.
A. quadratic; positive B. linear; negative C. quadratic; negative D. linear; positive