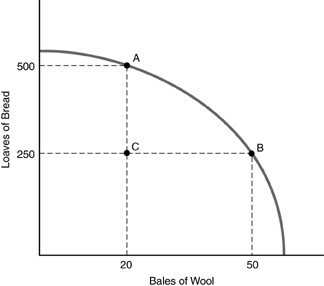
 Refer to the above figure. Which one of the following statements is TRUE with regard to the economy depicted in the graph?
A. The total amount of resources it takes to produce 20 bales of wool and 500 loaves of bread is more than the amount of resources needed to produce 50 bales of wool and 250 loaves of bread.
B. The total amount of resources it takes to produce 20 bales of wool and 500 loaves of bread is the same as the amount of resources needed to produce 50 bales of wool and 250 loaves of bread.
C. Point C cannot be produced.
D. The best production point is 500 loaves of bread and 50 bales of wool.
Answer: B
You might also like to view...
What approach to fairness argues in favor of government policies that redistribute income so that there is more equality of income?
What will be an ideal response?
Refer to Table 4-3. The table above lists the marginal cost of cowboy hats by The Waco Kid, a firm that specializes in producing western wear. If the price of cowboy hats increases from $38 to $46
A) there will be a surplus of cowboy hats. B) producer surplus will rise from $22 to $46. C) consumers will buy no cowboy hats. D) the marginal cost of producing the third cowboy hat will increase to $46.
With respect to U.S. Treasury bills,
A) the bid price is always greater than the asked price. B) the asked price is always greater than the bid price. C) the bid price is only greater than the asked price if investors expect interest rates to decline in the future. D) the asked price is only greater than the bid price if investors expect interest rates to decline in the future.
To boost economic growth the government is most likely to:
A. increase interest rate B. increase taxation rate C. provide incentives to invest D. provide incentives to save