Plot and interpret the appropriate scatter diagram.The one-day temperatures for 12 world cities along with their latitudes are shown in the table below. Make a scatter diagram for the data. Describe what happens to the one-day temperatures as the latitude increases.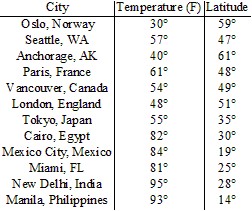 Latitude (degrees)
 Temperature (F)°
What will be an ideal response?
Latitude (degrees)
Temperature (F)°
As the latitude increases, the one-day temperatures decrease.
Mathematics
You might also like to view...
Provide an appropriate response._______ growth occurs when a quantity grows by the same relative amount in each unit of time.
A. Linear B. Static C. Exponential D. None of the above
Mathematics
Solve the problem.Find the image of the given figure under the translation that takes P to P'.
A. 
B. 
C. 
D. 
Mathematics
Find the discount period.Loan made: Sep 10Length of loan: 320 daysDate of discount: Mar 6
A. 177 days B. 146 days C. 143 days D. 174 days
Mathematics
Find the zero of the linear function.s(t) =  t - 5
t - 5
A. -1 B. 1 C. 20 D. -20
Mathematics