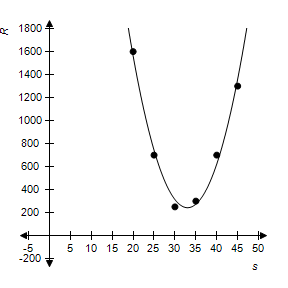
The following table shows the rate R, in accidents per hundred million miles, of accidents versus the speed s, in miles per hour. The data refers to urban streets at night.
s 20 25 30 35 40 45 R 1600 700 250 300 700 1300?
A: Use quadratic regression to model the accident rate as a function of the speed. Round your answers to two decimal places, if necessary.B: Plot the data along with the graph of the model you found in part A.C: According to the model you found, what is the safest speed to drive on urban streets at night? Round your answer to two decimal places.
What will be an ideal response?
?
A: 
?
B:
?
?
C: 33.01 miles per hour
Mathematics
You might also like to view...
Plot the point on the rectangular coordinate system provided. Write the corresponding letter as your answer.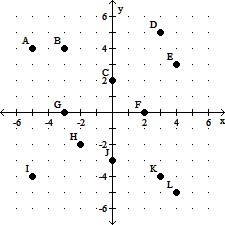 (3, 5)
A. K B. L C. I D. D
Mathematics
Determine the phase shift of the function.y = 3 sin 
A.  units to the left
B.  units to the right
C. ? units to the right
D.  units to the left
Mathematics
Identify the constant term, leading term, and leading coefficient of the polynomial.-a + 8a3 - 6a7 + 5a2
A. 0 ; 8a3 ; 8 B. -6 ; 5a2 ; 5 C. 0 ; -6a7 ; -6 D. -6 ; -a ; -1
Mathematics
Simplify.
A. 
B. 
C. 
D. 
Mathematics