Use the line graph to answer the question.Beginning with 1984, Lisa purchased a car every four years. The line graph illustrates the average fuel mileage in miles per gallon for each car. Between which two consecutive purchases did the greatest increase occur?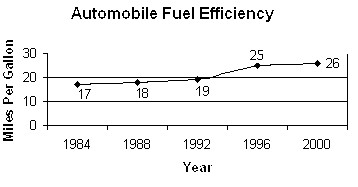
A. It is not possible to answer this question using the line graph.
B. 1992 to 1996
C. 1984 to 1988
D. 1996 to 2000
Answer: B
Mathematics
You might also like to view...
Solve the problem.Evaluate  at t = 2? for the function w = x2 - y2 - 9x; x = cost, y = sin t.
A. -11 B. -13 C. 0 D. -7
Mathematics
L'Hopital's rule does not help with the given limit. Find the limit some other way.

A. 1 B. 0 C. -1 D. ?
Mathematics
Classify the angle as acute, right, obtuse, or straight.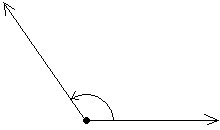
A. straight B. obtuse C. right D. acute
Mathematics
Solve and graph the solutions. < 7
< 7![]()
A. ![]()
B. ![]()
C. ![]()
D. ![]()
Mathematics