The investment schedule is downward sloping and the saving schedule is upward sloping with respect to the interest rate. Suppose the equilibrium real investment per year at the market rate of interest is $1 trillion
How is this represented when real national income per year is on the horizontal axis? How is this incorporated into the consumption-function graph?
Investment spending is a function of the interest rate, but it is autonomous with respect to real Gross Domestic Product (GDP). So the investment function is a horizontal line at $1 trillion when real Gross Domestic Product (GDP) per year is on the horizontal axis. The C + I curve is found by vertically summing the upward sloping consumption curve with the horizontal investment curve. The C + I curve slopes up and is always $1 trillion higher than the C curve.
You might also like to view...
In 2012, Ben Bernanke expressed which concern about persistently high unemployment?
A) It would result in high inflation. B) It would result in structural damage to the economy that would last for years. C) It would never decline to desired levels. D) It would cost him his job.
The investment curve is ________ of (on) the level of national income and ___________ as the interest rate falls
a. independent; quantity demanded of investment decreases b. dependent; quantity demanded of investment increases c. independent; quantity demanded of investment increases d. dependent; quantity demanded of investment remains unchanged e. dependent; investment curve shifts from horizontal to upward sloping
If the market price is above the perfectly competitive firm's average total cost curve, we expect that in the long run
(A) the industry contracts as firms exit the market. (B) the industry expands as firms exit the market. (C) the industry contracts as firms enter the market. (D) the industry expands as firms enter the market. (E) the government seeks to regulate the market to ensure efficient outcomes.
Refer to the accompanying figure. The total utility of consuming 4 pizzas a week is: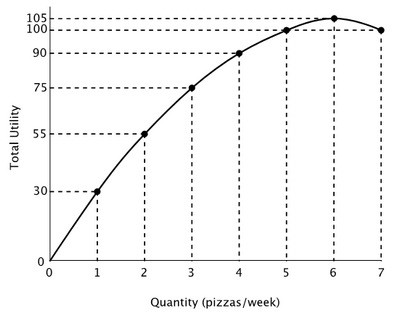
A. 22.5 B. 90 C. 75 D. 15