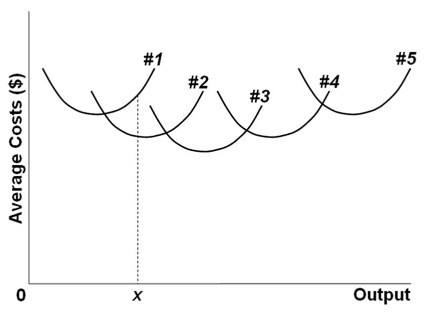
 The above diagram shows the short-run average total cost curves for five different plant sizes of a firm. The position of these five curves in relation to one another reflects:
A. the law of diminishing returns.
B. the law of constant costs.
C. the effect of fixed costs on ATC as output increases.
D. economies and diseconomies of scale.
Answer: D
You might also like to view...
A higher rate of saving at the national level will, in the long-run ________
A) cause a decrease in levels of capital and output B) have no effect on levels of capital and output C) lead to an increase in population growth D) cause an increase in levels of capital and output
Which of the following utility functions has the same MRS as U(q1,q2 ) = q1 q2?
A) q11/2 q21/2 B) q1 + q2 C) q11/2 + q21/2 D) (q11/2 + q11/2 )2
The marginal propensity to consume is the
What will be an ideal response?
When a firm is experiencing economics of scale, long run
a. average total cost is minimized, b. average total cost is greater than long-run marginal cost, c. average total cost is less than long-run marginal cost, d. marginal cost is minimized. e. none of the above