What type of graph would be best to display this information?
You want to display data on the finish times of the 10 fastest race horses in a single race at the Kentucky Derby.
A) bar graph
B) scatter plot
C) line graph
A) bar graph
Anatomy & Physiology
You might also like to view...
True flight first arose in
A) Bats. B) Birds. C) Insects. D) Reptiles.
Anatomy & Physiology
Using Figure 6.2, match the following:
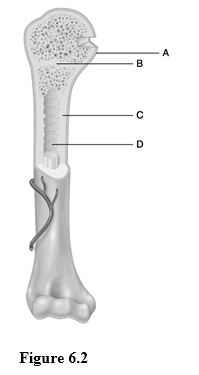
1) Compact bone.
2) Location of the epiphyseal line.
3) Area where yellow marrow is found.
4) Area with articular cartilage.
Anatomy & Physiology
Bile salts are derivatives of ________.
A. bilirubin B. hemoglobin C. cholesterol D. sodium chloride
Anatomy & Physiology
Define permeability
What will be an ideal response?
Anatomy & Physiology