Solve the problem.In a Psychology class, the students were tested at the end of the course on a final exam. Then they were retested with an equivalent test at subsequent time intervals. Their average scores after t months are given in the table.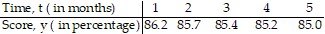 Using a graphing utility, fit a logarithmic function y = a + b ln x to the data. Using the function you found, estimate how long will it take for the test scores to fall below 84%. Express your answer to the nearest month.
A. 12 months
B. 8 months
C. 10 months
D. 20 months
Answer: D
Mathematics
You might also like to view...
Find the intervals on which the function is continuous.y = 
A. discontinuous only when x = -16 or x = 16 B. discontinuous only when x = 16 C. discontinuous only when x = -4 D. discontinuous only when x = -4 or x = 4
Mathematics
Solve the problem.Bill kept track of the number of hours he spent exercising each week. The results for four months are shown below. Find the mean number of hours Bill spent exercising per week. Round to the nearest hundredth.6.60 8.70 6.60 6.90 6.60 6.608.70 6.60 6.60 6.60 6.90 7.507.40 8.70 8.70 8.30 6.60 8.70
A. 7.41 B. 7.02 C. 7.84 D. 7.62
Mathematics
Graph the function.f(x) = 
A. 
B. 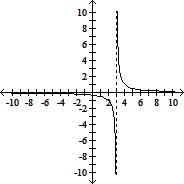
C. 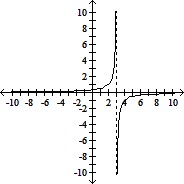
D. 
Mathematics
Solve the equation. +
+  = -2
= -2
A. ?
B. 
C. 
D. 
Mathematics