Solve the problem.The following graph shows the private, public and total national school enrollment for students for select years from 1970 through 2000.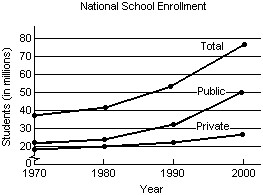 i) How is the graph for total school enrollment, T, determined from the graph of the private enrollment, r, and the public enrollment, u?ii) During which 10-year period did the total number of students enrolled increase the least?iii) During which 10-year period did the total number of students enrolled increase the most?
A.
| i) | T is the sum of r and u. |
iii) 1990-2000
B.
| i) | T is the difference of r and u. |
iii) 1990-2000
C.
| i) | T is the sum of r and u. |
iii) 1970-1980
D.
| i) | T is the sum of r and u. |
iii) 1980-1990
Answer: A
You might also like to view...
Solve the problem.Imagine a force field in which the force is always perpendicular to dr. What is special about the work done in moving a particle in such a field?
What will be an ideal response?
Write the number as indicated.A company had net revenues of $8,500,495 in one year. Write the number in words.
A. Eight million, five hundred thousand, four hundred ninety-five dollars B. Eight million, five hundred thousand, four thousand ninety-five dollars C. Eight million, fifty thousand, four hundred ninety-five dollars D. Eight million, five thousand, four hundred ninety-five dollars
Estimate by using front-end rounding. 
A. 12,950 B. 13,740 C. 13,730 D. 13,731
Use the properties of limits to find the indicated limit.

A. 0
B. 4
C. - 
D. does not exist