This graph represents the cost and revenue curves of a firm in a perfectly competitive market.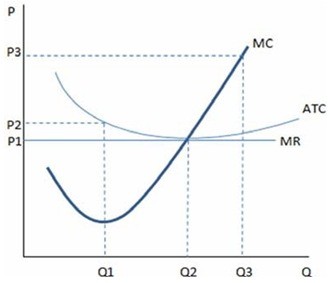 According the graph shown, the firm's most efficient scale of operation is to produce quantity:
A. Q1.
B. Q2.
C. Q3.
D. Any quantity as long as P1 is charged.
Answer: B
You might also like to view...
If the price of gasoline increases significantly, then we'd expect the demand curve for large hybrid and electric cars to
A. not shift, but there will be a movement along that demand curve. B. shift to the right. C. shift to the left. D. become upward-sloping.
Gomer can make either 200 gallons of corn liquor (L) or 200 gallons of strawberry wine (W) every six months. Goober can make only 100 gallons of corn liquor (L) or 50 gallons of strawberry wine (W) every six months. Which statement below is true?
A) Gomer produces W more efficiently than Goober. B) Gomer produces L less efficiently than Goober. C) Goober produces L more efficiently than Gomer. D) All of the above are true.
Which of the following would lead you to predict an upward shift in the consumption function?
a. a decrease in the value of real wealth b. a decrease in disposable income c. an increase in the value of real wealth d. an increase in the price level
The modern era of trade unionism began around _______ with the founding of the _______.
Fill in the blank(s) with the appropriate word(s).