First, create a scatter plot for the data in the table. Then, use the shape of the scatter plot given to determine if the data are best modeled by a linear function, an exponential function, a logarithmic function, or a quadratic function.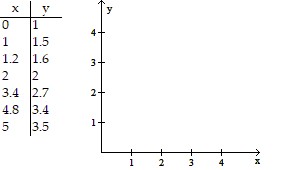
A. 
quadratic function
B. 
exponential function
C. 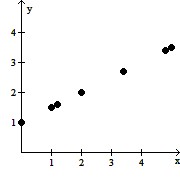
linear function
D. 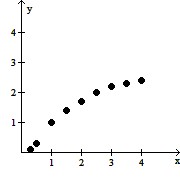
logarithmic function
Answer: C
You might also like to view...
Solve the problem.Mari drops a ball from a height of 23 meters and notices that on each bounce the ball returns to about  of its previous height. About how far will ball travel before it comes to rest?
A. 161 m B. 184 m C. 92 m D. 53.7 m
Give a geometric description of the set of points whose coordinates satisfy the given conditions.(x - 2)2 + (y - 10)2 + (z - 8)2 < 4
A. No set of points satisfy the given relations. B. All points on the lower hemisphere centered at (2, 10, 8) C. All points within the lower hemisphere centered at (2, 10, 8) D. All points outside the lower hemisphere centered at (2, 10, 8)
Calculate the flux of the field F across the closed plane curve C.F = x2i + y2j; the curve C is the closed counterclockwise path around the triangle with vertices at 
 and
and 
A. 20
B. - 4
C. 
D. 0
Rewrite the equation such that each resulting term or combination is in an integrable form.x dy + x2y dy = y dx
A.  + xy dy = 0
B. (x dy - y dx) + x2y dy = 0
C.  + dy -
  = 0
= 0
D.  + y dy = 0