An individual labor-demand curve represents:
A. the decisions of all firms around how many hours to work at each alternative wage.
B. the decisions of all workers around how many hours to work at each alternative wage.
C. a worker's decisions around how many hours to work at each alternative wage.
D. a firm's decisions around how many hours to hire at each alternative wage.
Answer: D
You might also like to view...
The demand for cars in a certain country is given by: D = 20,000 - P, where P is the price of a car. Supply by domestic car producers is: S = 5,000 + 0.5P. If this economy is open to trade, and the world price of a car is $6,000, how many cars will be imported?
A. 3,000 B. 2,000 C. 4,000 D. 6,000
Suppose the total monetary value of all final goods and services produced in a particular country during one year is $500 billion, and the total monetary value of final goods and services sold is $450 billion. We can conclude that ________.
A. real GDP in 2010 is $450 billion B. inventories in 2010 fell by $50 billion C. nominal GDP in 2010 is $450 billion D. nominal GDP in 2010 is $500 billion
Which is the most accurate statement?
A. Our trade problems with Japan and China are very similar. B. Japanese markets have been at least somewhat closed to imports. C. If Japan and China traded fairly, our trade deficits with those two countries would disappear. D. Our trade deficits with Japan and China account for almost our entire trade deficit.
Refer to the information provided in Figure 3.10 below to answer the following question(s).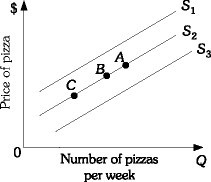 Figure 3.10Refer to Figure 3.10. An increase in the price of pizza sauce will cause a movement from Point B on supply curve S2 to
A. supply curve S3. B. Point A on supply curve S2. C. supply curve S1. D. Point C on supply curve S2.