Based on the figure below. Starting from long-run equilibrium at point C, a tax increase that decreases aggregate demand from AD1 to AD will lead to a short-run equilibrium at point ________ and eventually to a long-run equilibrium at point ________, if left to self-correcting tendencies.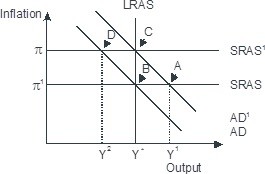
A. D; C
B. D; B
C. A; B
D. B; C
Answer: B
You might also like to view...
As the nominal interest rate increases ________
A) it becomes more costly to hold money instead of bonds B) the quantity of money demanded falls C) the opportunity cost of holding money rises D) all of the above E) none of the above
During 1979-2005, the mortgage default rate
a. was less than the foreclosure rate. b. soared to more than 5 percent during recessions but declined sharply during economic expansions. c. soared to more than 5 percent during expansions but declined sharply during economic recessions. d. was generally between 1 and 2 percent.
A household member's decision about how much labor to supply is most closely linked to
a. the supply of factors of production other than labor. b. technological change. c. the tradeoff between leisure and work. d. immigration trends.
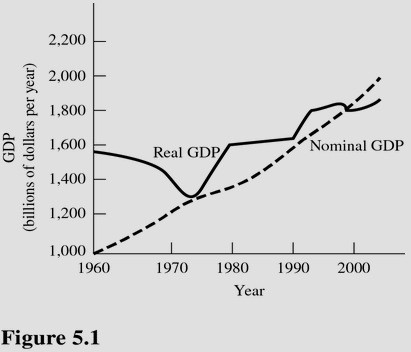 In Figure 5.1, during the period between the early 1970s and 1980, real GDP grew at a faster rate than nominal GDP. This is an indication that
A. Average price levels increased. B. Production increased at a slower rate than average price increased. C. Production increased at a faster rate than average price increased. D. Average price levels decreased.