The aggregate demand curve shows the combinations of output and the price level that put the economy on
A) the FE line and the IS curve.
B) the FE line, the IS curve, and the LM curve.
C) the IS curve.
D) the IS curve and the LM curve.
D
You might also like to view...
In a circular-flow diagram, the saving and taxation "pipes" are carrying
A) injections to firms. B) injections to households. C) leakages from firms. D) leakages from households.
Refer to the graph shown depicting a monopolistically competitive firm. The average total cost curve is represented by curve: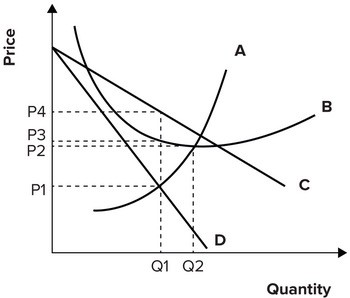
A. A. B. B. C. C. D. D.
How does the income distribution in the United States compare to other developed countries?
A. The income distribution is vastly more unequal in the United States compared to other developed countries. B. The income distribution must be the same in all developed countries, the United States included, because of increased globalization. C. The income distribution is vastly more equal in the United States compared to other developed countries. D. The income distribution tends to be more unequal in the United States compared to other developed countries, but not by a huge amount. E. The income distribution tends to be more equal in the United States compared to other developed countries, but not by a huge amount.
A person who chooses not to be in the labor force reveals that
A. either leisure or the value of nonpaid labor is worth zero to him. B. his potential product in the market is zero. C. either leisure or the value of nonpaid labor is worth more to him than the value that society places on his potential product in the market. D. either leisure or the value of nonpaid labor is worth less to him than the value that society places on his potential product in the market.