Refer to the above graph. What will be the quantity extracted if user costs are considered compared to the case where they are not considered?
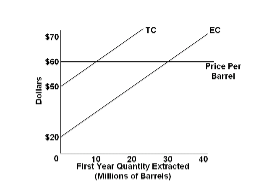
Use the following graph to answer question. It shows the extraction costs for TX Oil Company n the first year in a situation where it will extract oil from a reserve over two years.
A. 10 units versus 20 units
B. 20 units versus 10 units
C. 10 units versus 30 units
D. 20 units versus 40 units
C. 10 units versus 30 units
You might also like to view...
The data in the table above shows the consumption by families in a small (poor) economy. The families consume only salt and bread. The reference base period is 2011. The cost of the CPI market basket in 2011 is
A) $64.00. B) $3.50. C) $52.00. D) $5.00. E) $100.
Suppose that an increase in capital per hour worked from $15,000 to $20,000 increases real GDP per hour worked by $500
If capital per hour worked increases further to $25,000, by how much would you expect real GDP per hour worked to increase if there are diminishing returns? A) by less than $500 B) by more than $500 but less than $5,000 C) by exactly $500 D) by more than $5,000 but less than $20,000
After a price ceiling of $8 is placed on the market in the graph shown, the total number of units traded:
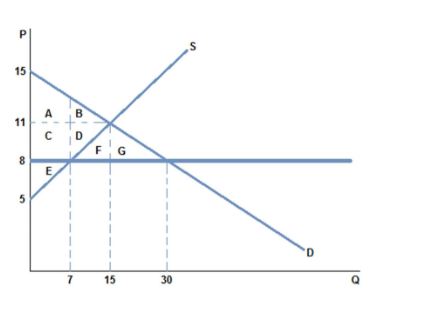
A. falls by 8 relative to equilibrium.
B. falls by 15 relative to equilibrium.
C. falls by 23 relative to equilibrium.
D. increases by 15 relative to equilibrium.
Specialization and trade do not allow individuals, firms, or even nations to acquire goods that lie beyond their production capabilities
a. True b. False Indicate whether the statement is true or false