Solve the problem.The paired data below consist of the temperatures on randomly chosen days and the amount a certain kind of plant grew (in millimeters). Use a graphing calculator to find the equation of the regression line of the following data. Let x represent temperature.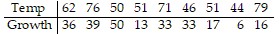
A. y = 0.122x + 7.30
B. y = -0.211x - 14.6
C. y = -0.112x + 7.30
D. y = 0.211x + 14.6
Answer: D
You might also like to view...
Describe the graph of the polar equation.r2 = 24r cos ?
A. Circle of radius 12 and center (12, 0) B. Vertical line passing through (24, 0) C. Circle of radius 12 and center (0, 12) D. Horizontal line passing through (0, 24)
The average speed of a vehicle on a stretch of a route between 6 A.M. and 10 A.M. on a typical weekday is approximated by the function
?

 , where
  is measured in miles per hour and
  is measured in hours, with
  corresponding to 6 A.M.
?
At what time of the morning commute is the traffic moving at the slowest rate? What is the average speed of a vehicle at that time?
?
time = __________ A.M.
?
average speed = __________ mph
What will be an ideal response?
Solve. = 9
= 9
A. 
B. 
C. 
D. 
Solve the equation by completing the square.x2 - 4x + 20 = 0
A. -2 ± 4i B. 6, -2 C. 2 ± 4i D. 4 ± 8i