The table shows, for some particular year, a listing of several income levels and, for each level, the proportion of the population in the level and the probability that a person in that level bought a new car during the year. Given that one of the people who bought a new car during that year is randomly selected, find the probability that that person was in the indicated income category. Round your answer to the nearest hundredth. 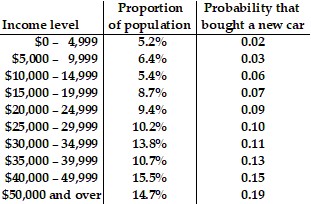 $5,000 - $9,999
A. 0.03
B. 0.05
C. 0.01
D. 0.02
Answer: D
You might also like to view...
Provide an appropriate response.Consider the following clause in a rental lease:"Lessee may terminate this lease at the end of the initial term by providing Lessor with at least sixty (60) days prior written notice, to commence upon the first day of the month following the month in which said notice is delivered or immediately if delivered on the first day of any month."If the initial term of the lease ends on March 31 and the Lessee provides the Lessor written notice on April 1, as of what date can the lease be terminated? What if he provides notice on April 2?
What will be an ideal response?
Use Gaussian elimination to solve the linear system by finding an equivalent system in triangular form.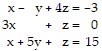
A. (0, 3, 0) B. no solution C. (0, 3, -3) D. (0, 0, 3)
Find the median.9, 15, 21, 29, 37, 37
A. 24.5 B. 29 C. 21 D. 25
State whether the parabola opens upwards or downwards.y =  x2 - 2
A. Upwards B. Downwards