The following graph shows average fixed costs, average variable costs, average total costs, and marginal costs of production.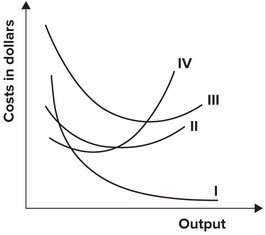 In the graph shown, the marginal cost curve is represented by which curve?
A. I
B. II
C. III
D. IV
Answer: D
Economics
You might also like to view...
Deadweight loss exists when a market is operated by a monopoly because the monopolist produces at an output level that is ____ the socially optimal level
Fill in the blank(s) with the appropriate word(s).
Economics
Managed equity funds
What will be an ideal response?
Economics
If a 1% change in price leads to a 2% change in quantity demanded, then the elasticity of demand is
A. 0.5. B. 1.0. C. 1.5. D. 2.0.
Economics
The distribution of income in one nation can be illustrated by the
A) Laffer curve. B) aggregate demand curve. C) Lorenz curve. D) Phillips curve.
Economics