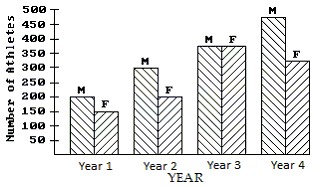
This double-bar graph shows the number of male (M) and female (F) athletes at a university over a four-year period. Answer the question. What percentage of all students involved in athletics in Year 1 was female? (Round to the nearest percent.)
A. 14%
B. 43%
C. 75%
D. 57%
Answer: B
You might also like to view...
Solve the problem.Find the volume of the solid generated by revolving the region bounded by the curve  the
the  and the vertical line
  about the x-axis.
A. 2?(e2 - 1) B. ?(e2 - 1) C. ?(e - 1) D. ? e
Find two equivalent expressions for the opposite of the polynomial.-4x4 +  x2 + 6x - 5
A. -(-4x4 +  x2 + 6x - 5); 4x4 +
  x2 + 6x - 5
B. -(-4x4 +  x2 + 6x - 5); -4x4 -
  x2 - 6x - 5
C. -(-4x4 +  x2 + 6x - 5); 4x4 -
  x2 - 6x + 5
D. -(-4x4 +  x2 + 6x - 5); -4x4 -
  x2 + 6x - 5
Subtract.-6 - (-6)
A. 6 B. 1 C. 0 D. -6
Suppose spending for a wireless communications services (in billions of dollars per year) can be modeled by the function 

src="https://sciemce.com/media/3/ppg__cognero__Chapter_13_Definite_Integrals_Techniques_of_Integration__media__f6e04356-ddf7-46e1-abc5-5e65ba3752d7.PNG" style="vertical-align:middle;" /> equal subdivisions with right-hand endpoints to approximate the area under the graph of S(t) between 
