Which of the following illustrations best represents a bar graph?
?
A. 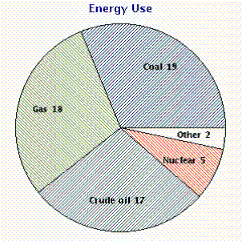
B. 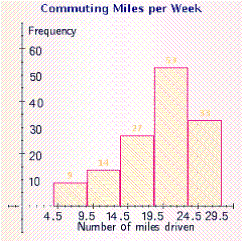
C. 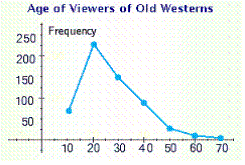
D. 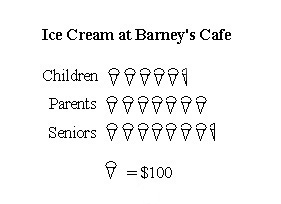
E. 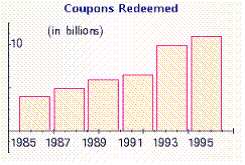
Answer: E
Mathematics
You might also like to view...
Perform the indicated operation or operations. Simplify, if possible. -
- 
A. x + 4
B. 
C. 
D. 
Mathematics
Convert using dimensional analysis.8 days to minutes
A. 28,800 min. B. 11,520 min. C. 192 min. D. 691,200 min.
Mathematics
Does the equation  have any roots that are real numbers?
?
have any roots that are real numbers?
?
A. no B. yes
Mathematics
Solve the problem.Since 2000, the number of students enrolled at Midville College in year x may be modeled using 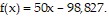 Estimate the year in which the enrollment was 1523.
A. 2007 B. 2009 C. 2005 D. 2006
Mathematics